SaaS KPIs and Metrics

Options
Jordan Silverman
Jordan Silverman Member, CS Leader Posts: 109 Expert
First Comment 5 Likes Photogenic First Anniversary
edited February 2021 in Metrics & Analytics
@Alex Farmer wrote a good article here on the most important metrics to track.

https://www.gaingrowretain.com/blogs/alex-farmer1/2021/01/12/top-five-metrics-to-track-on-your-customer-success

I am currently working on revamping my CS revenue metrics and KPIs.

For sure missing a lot on the list, but the list is specifically focused on revenue management and less on customer service, NPS, and onboarding.

What revenue metrics am I missing?
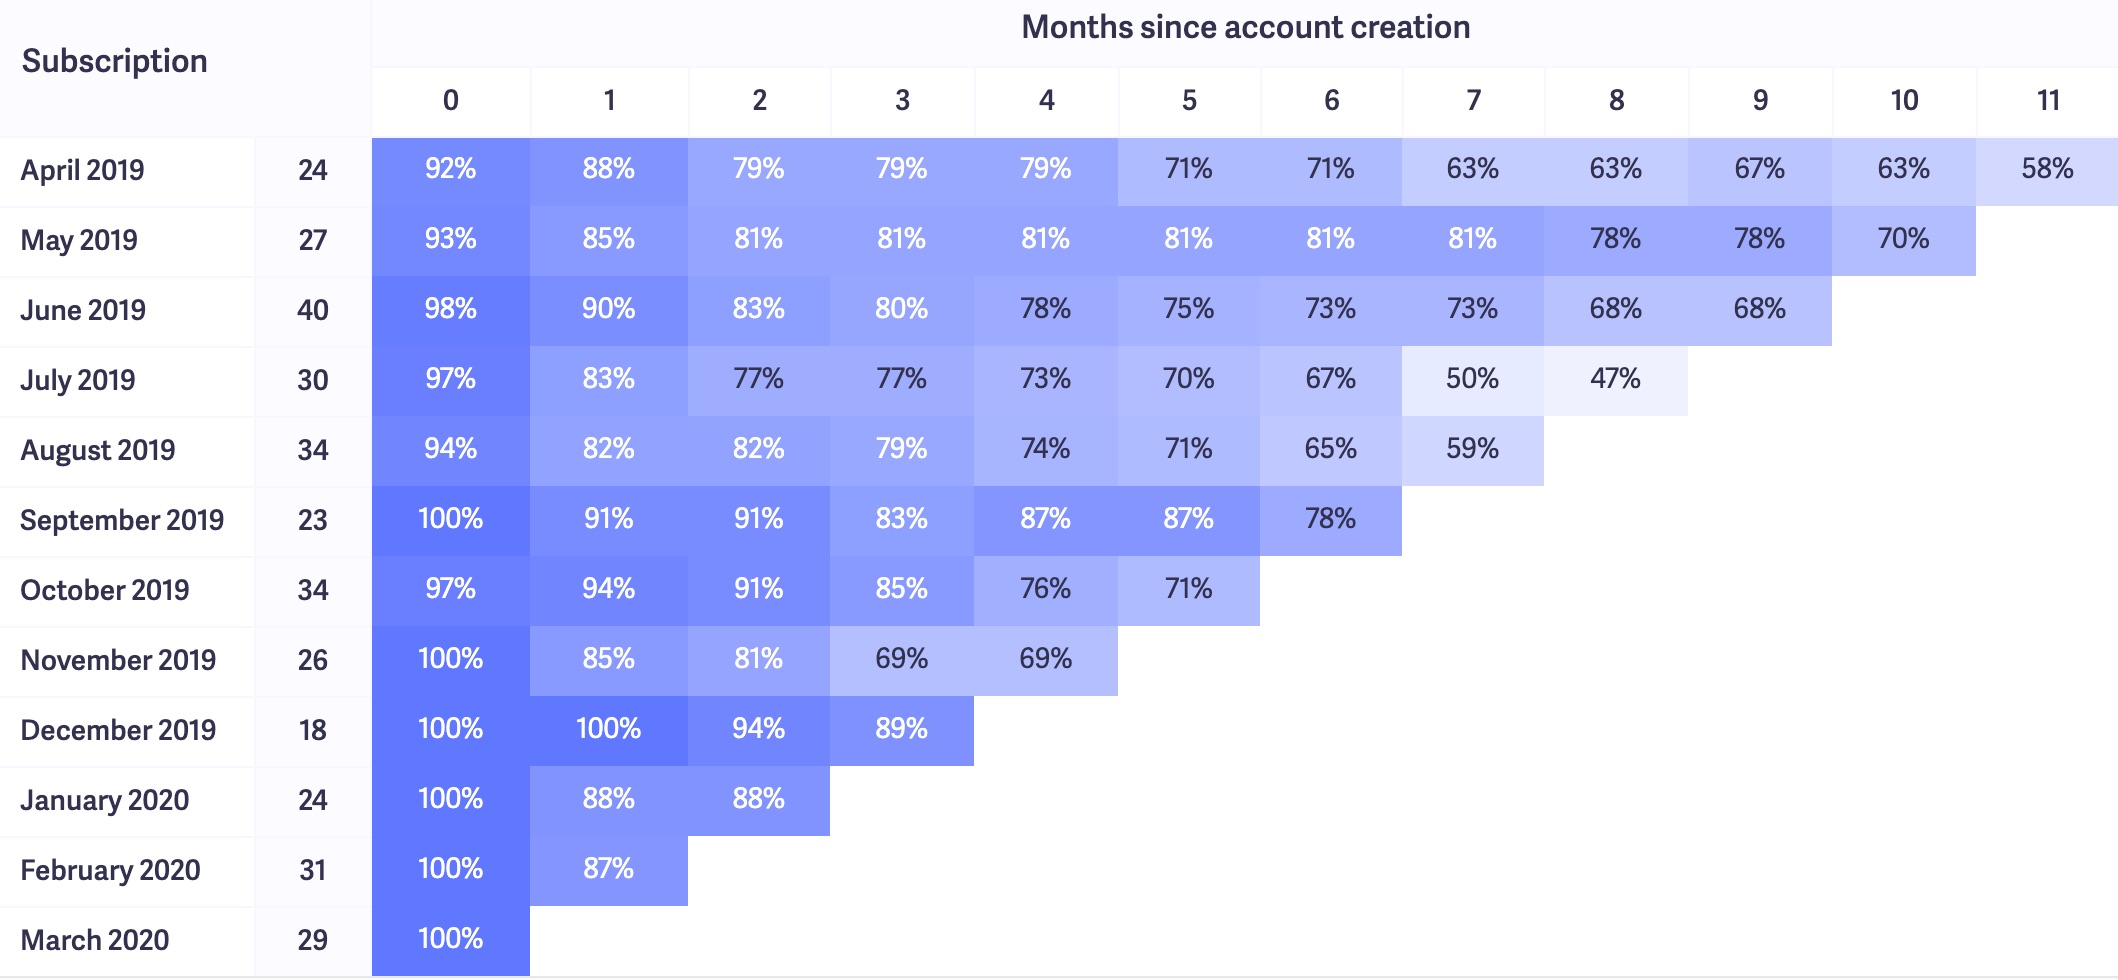
- Net Churn
- Customer Churn
- Revenue Churn
- ARPU
- Customer lifetime
- LTV
- MRR
- Cohort analysis
Jordan Silverman
jordan.silverman@usestarfish.com
(914) 844-5775
https://www.linkedin.com/in/jordansilverman/

Comments

  • Pam Micznik
    Pam Micznik Member Posts: 50 Expert
    5 Likes Name Dropper First Comment Photogenic
    edited February 2021
    Options
    Alex's blog isn't there anymore.
  • Jordan Silverman
    Jordan Silverman Member, CS Leader Posts: 109 Expert
    First Comment 5 Likes Photogenic First Anniversary
    edited February 2021
    Options
    So weird! @Jeff Breunsbach any idea what happened here? It was live yesterday but now when you click it does not exist?
    Jordan Silverman
    jordan.silverman@usestarfish.com
    (914) 844-5775
    https://www.linkedin.com/in/jordansilverman/
  • Morgan Pottruff
    Morgan Pottruff Member Posts: 8 Seeker
    First Anniversary
    edited February 2021
    Options
    What is cohort analysis exactly I haven't heard that term yet?

    Morgan Pottruff

    Making technology easy for people 
    Education | E-Learning | Live and Virtual Events

    Online E-Learning Portfolio and CV

    www.morganpottruff.com

  • Jordan Silverman
    Jordan Silverman Member, CS Leader Posts: 109 Expert
    First Comment 5 Likes Photogenic First Anniversary
    edited February 2021
    Options
    @Morgan Pottruff good question!

    Cohort analysis is a way to see a segment of customers behavior over time.

    We use it to see churn and upsells in certain months.

    acquisition cohort table
    So from this kind of chart we can see:
    1) Is a group of clients that signed up performing worse
    2) Is there a certain month into the subscription we start to see churn, upsells, etc.

    This article is a little long but goes in depth nicely - https://baremetrics.com/blog/cohort-analysis
    Jordan Silverman
    jordan.silverman@usestarfish.com
    (914) 844-5775
    https://www.linkedin.com/in/jordansilverman/
  • Shari Srebnick
    Shari Srebnick Member Posts: 111 Expert
    First Comment First Anniversary Name Dropper
    edited February 2021
    Options
    Hey Jordan,

    Thanks for providing more context.  I was wondering the same thing as Morgan.

    I have another question, and forgive me if this seems obvious/silly; maybe I am just missing something.  For this analysis, you mention that this can be used to discover a pattern around churn or expansion by month.  But - how often do we see churn at month 3 of a 12 or 24 month subscription?  Or even month 6?  Yes, it can happen and I'd say if it happens often there are bigger issues.  But in my 5 year experience at my current company, churn almost always happens around the time we start the renewal conversations or sometimes like 2 weeks before. Rarely does it happen so far in advance.

    I guess I'm just trying to figure out if this is worth doing.   

    TIA!
  • Jordan Silverman
    Jordan Silverman Member, CS Leader Posts: 109 Expert
    First Comment 5 Likes Photogenic First Anniversary
    edited February 2021
    Options
    @Shari Srebnick I think you bring up an important point that what you are analyzing in the Cohort will be based on your business model.

    For us - 90% of contracts are monthly so we want to look at it starting in month 1.

    For you with annual you would probably start analyzing at month 12.

    So totally agree where you start analyzing will depend on contract type and segmentation you are looking at.
    Jordan Silverman
    jordan.silverman@usestarfish.com
    (914) 844-5775
    https://www.linkedin.com/in/jordansilverman/
  • Shari Srebnick
    Shari Srebnick Member Posts: 111 Expert
    First Comment First Anniversary Name Dropper
    edited February 2021
    Options
    Ok that makes much more sense.  Thank you!
  • Srikrishnan Ganesan
    Srikrishnan Ganesan Member Posts: 26 Expert
    edited February 2021
    Options

    We used to use 2 kind of cohort analyses:

    1. Count of logos/ accounts over time - just purely logo / account churn over time (again monthly or annual depending on whether you have monthly or annual contracts)
    2. MRR from the cohort over a period of time - this is most interesting as even if number of accounts go down, there may be enough expansion to make up for it from the other accounts. You want to see the NRR (net revenue retention) > 100% after 12 months. There are companies that have it over 120%, 140%, etc - which means without adding new customers their revenues will still be growing 20% or 40% year on year.  Every company board cares about this number now, in addition to how your revenues are growing overall. 

  • Saad Khan
    Saad Khan Member Posts: 10 Contributor
    First Anniversary
    edited February 2021
    Options
    Shari,

    Even if you are on an annual  contact with your customer, you should still use cohort analysis to see adaption rates, usage etc. Theses are indicators of churn and renewal. In my opinion even 90 days out is the wrong time to try to correct the ship and the customer will churn, because there have been  3 quarters to figure it out.

    Monitoring these these metrics and being proactive will always lead to issue discovery and resolution to reduce churn.
  • Ed Powers
    Ed Powers Member Posts: 180 Expert
    Photogenic 5 Insightfuls First Anniversary 5 Likes
    edited February 2021
    Options
    Interesting thread. One of the reasons why I created a Udemy course and partnered with SuccessHACKER to deliver an instructor-led version of Data-Driven Decision Making for Customer Success is because of widespread misuse of numbers in our profession. It's totally understandable--most of us hate math and we received poor statistics education along the way--but the consequences can be devastating. In Customer Success, even small changes in churn percentages have substantial impact over time, to the tune of millions of dollars in revenue and tens of millions in company valuations. That means when we analyze data we must use the correct statistical tools to separate the 'signal' from the 'noise.'

    @Jordan Silverman's cohort analysis example is a case in point (and I don't mean to pick on him!) but this type of analysis is widely used and often misleading. The numbers in this table show mostly random variation: there's little 'signal' here, just 'noise.'

    How do we know? The cohorts vary in size, ranging between 18 and 40 accounts. Whenever we compute percentages like these, we must pay very close attention to the denominators. Statisticians say that whenever denominators vary by 25%, then sampling errors become excessive and comparisons between groups should be avoided. If we compare the 9% difference at Month 3 for the June and December cohorts using proper statistical analysis, for example, we calculate p=0.2, meaning the difference is not statistically significant. Other groups, however, may indeed show a real difference--December and November in Month 3 yield p=0.06, very close to being considered statistically significant. However, cohort analyses like these mask important findings because sample sizes for groups are chosen arbitrarily (by month) instead of using fixed denominators, which reduces the measurement error.  

    The mathematically correct and more accurate approach is to use a control chart, in this case, a P-chart, or proportion chart. It's specifically designed to show when variation is random and when it is due to an assignable cause, such as a spurious event or a shift in the process. It guides leaders on what to do--investigate the cause, improve the process, or do nothing at all. Control charts have been used in manufacturing and service industries for decades but are virtually unknown in the software industry.

    Perhaps it's time we changed that.
  • Srikrishnan Ganesan
    Srikrishnan Ganesan Member Posts: 26 Expert
    edited February 2021
    Options
    Ed, I think you should also pitch this course to VCs who want to see this data but probably aren't paying attention to the sample sizes :). Completely concur with you on this. With cohort analysis, if you are working with small numbers, one big account churning vs growing can make the data look very very different, all else remaining the same.
    @Ed Powers Would you say we go with a 6 month rolling average for a metric like NRR?
  • Jordan Silverman
    Jordan Silverman Member, CS Leader Posts: 109 Expert
    First Comment 5 Likes Photogenic First Anniversary
    edited February 2021
    Options
    @Ed Powers no picking at all! My original question was what should the key KPIs be and what am I missing - so this is great insight!

    Can you give an example of how you would build a proportion chart and the steps to analyze this?
    Jordan Silverman
    jordan.silverman@usestarfish.com
    (914) 844-5775
    https://www.linkedin.com/in/jordansilverman/
  • Ed Powers
    Ed Powers Member Posts: 180 Expert
    Photogenic 5 Insightfuls First Anniversary 5 Likes
    edited February 2021
    Options
    Great comment on VCs, @Srikrishnan Ganesan--you'll love watching the Introduction video to my course!

    NRR is one of those troublesome areas. It's a blended metric, meaning multiple independent variables (e.g. revenue churn, down-sell, expansion, up-sell) all combine in the calculation. That produces lots of variation and difficulty telling exactly what may have changed. I always break NRR down and use control charts to show what actually happened. 

    My last CFO and the PE-backed board used 12-month trailing averages to track NRR on a monthly basis. Yes, rolling averages reduce the noise, and financial people certainly prefer it, but once again, masking the behavior doesn't lead to better decisions.

    We can't rely on the financial community to help. In my opinion, it's up to us as senior leaders to drill down and come prepared to show the correct numbers. Ultimately our job is prediction: looking forward, not in the rear-view mirror. That means we must understand what the numbers mean, how the system behaves, and how to accurately forecast what happens to y when we change x. That's the essence of good data-driven decision making.
  • Ed Powers
    Ed Powers Member Posts: 180 Expert
    Photogenic 5 Insightfuls First Anniversary 5 Likes
    edited February 2021
    Options
    Sure. Here's a video I did a few years back on p-charts: https://youtu.be/EZfpPbhuZlg

    To learn more about this, including using X-bar R, and X mR control charts for revenue churn and other variable data, you'll need to sign up for my course!
  • Shari Srebnick
    Shari Srebnick Member Posts: 111 Expert
    First Comment First Anniversary Name Dropper
    edited February 2021
    Options
    Hi Saad,

    Thank you for your insights.  

    While I don't currently have a cohort analysis, I do have other reporting in place that helps me measure our customers adoption and usage, among a few other key metrics and KPI's.  There are also other things we look at as indicators of churn, since usage is not always a great indicator.  

    We also start our renewals further out than 90 days.
  • Shari Srebnick
    Shari Srebnick Member Posts: 111 Expert
    First Comment First Anniversary Name Dropper
    edited February 2021
    Options
    Hi Ed,

    I love all of your insights around data and data driven decision making.  

    However, subjects such as statistics, advanced statistics, math modeling, calculus, etc.. are not my strong suit.  A good deal of it confuses and overwhelms me.  

    So, for someone like me (and I know I'm not alone in this), how do I go about this?  How do I break the NRR down to show what happened in a simpler way?   We currently track NRR, and I have a spreadsheet "tracker" that shows, by quarter, how much revenue is attributed to loss/churn, how much to upgrades/downgrades, and even by individual account.  I also use it to show, by Q, how much has been won and how much is open, along with Logo retention and churn rate %.

    Is there something I'm missing?
  • Ed Powers
    Ed Powers Member Posts: 180 Expert
    Photogenic 5 Insightfuls First Anniversary 5 Likes
    edited February 2021
    Options
    Hey @Shari Srebnick--

    There's nothing wrong with the way you're doing it--showing the NRR accounting breakdown by quarter is perfectly fine. The problem comes in when you compare what happened in the period vs. other periods, especially when it comes to percentage increases or decreases. Because of denominator neglect, chances are very good that your tracker gives you misleading information. This probably causes you and your exec team to over-react, fixing a non-problem, or worse, taking blame for something over which you have no influence. Your current tracker is probably not sensitive enough to show when you've made improvements, either, which makes it difficult to prove the ROI from your efforts. 

    The statistical techniques I describe are straightforward, but I understand the discomfort--you're definitely not alone! I see three options for you and other senior CS leaders: 
    1. I can help on a short-term project basis. Most of the challenge is getting the right data from the right systems into the right place for analysis, and that usually takes some time and effort to set up. Once it is, updating a control chart is a trivial matter. 
    2. You can build analysis capabilities in-house. A Customer Success Operations person or business analyst can do this work for you. Once you see what's truly going on, you'll want to dig deeper and make performance improvements, and that's when having someone with analytical skills can really make a difference. My Udemy and SuccessHACKER classes are perfect for them to learn the math. 
    3. You can outsource this analysis capability. Companies like ESG Success can deliver analytics like this on an ongoing basis. 
    I'm happy to chat if you want to explore these options. Shoot me a note to ed@se-partners.com and we'll grab a time.

    Ed
  • Alex Farmer
    Alex Farmer Member Posts: 62 Expert
    First Anniversary Photogenic First Comment GGR Blogger 2021
    edited February 2021
    Options
  • Alex Farmer
    Alex Farmer Member Posts: 62 Expert
    First Anniversary Photogenic First Comment GGR Blogger 2021
    edited February 2021
    Options
  • Laura Lakhwara
    Laura Lakhwara Member Posts: 45 Expert
    First Comment First Anniversary Photogenic
    edited February 2021
    Options
    @Maranda Dziekonski shared a great take on this: 

    Maranda Ann Dziekonski (she/her) on LinkedIn: #cs #customersuccess #customersuccessmanager
    Linkedin remove preview
    image
    Maranda Ann Dziekonski (she/her) on LinkedIn: #cs #customersuccess #customersuccessmanager
    Happy Monday, Success Peeps! ? This week's "quick tips" is centered around metrics. Last week I received a question from a newer Customer Success leader...
    View this on Linkedin >
  • Jordan Silverman
    Jordan Silverman Member, CS Leader Posts: 109 Expert
    First Comment 5 Likes Photogenic First Anniversary
    edited February 2021
    Options
    @Laura Lakhwara will you reshare? That link does not seem to be working.
    Jordan Silverman
    jordan.silverman@usestarfish.com
    (914) 844-5775
    https://www.linkedin.com/in/jordansilverman/
  • Laura Lakhwara
    Laura Lakhwara Member Posts: 45 Expert
    First Comment First Anniversary Photogenic
    edited February 2021
    Options
    All fixed @Jordan Silverman! Thanks for the flag.
  • Shari Srebnick
    Shari Srebnick Member Posts: 111 Expert
    First Comment First Anniversary Name Dropper
    edited February 2021
    Options
    Thanks, Ed!  This is helpful.  

    I'd say out of all of the options, #2 might be the one with the most legs.  We just hired a Business Analyst and I have an intro meeting with them on Thursday.  He is going to be responsible for setting up a system to support tracking company growth by overviewing different activities and wants to speak with me to discuss what I think matters regarding clients behavior that would be relevant to track.

    I'm mulling over a few things, but would love to hear what you suggest.  Can email you instead if easier.
  • Pete Hendry
    Pete Hendry Member Posts: 2 Navigator
    edited February 2022
    Options

    Great post on SaaS metrics! recently came across this image which covers customer KPIs for CSMs.

    image


    Thought it would be a great addition to the thread!


    Senior CSM
    ------------------------------
    -------------------------------------------
    Original Message:
    Sent: 02-08-2021 14:47
    From: Laura Lakhwara
    Subject: SaaS KPIs and Metrics

    All fixed @Jordan Silverman! Thanks for the flag.

  • Sudhinidra Raol
    Sudhinidra Raol Member Posts: 2 Navigator
    Photogenic
    edited February 2022
    Options
    Thanks Jordan for this and the link to the blog.
  • Brian Hansen
    Brian Hansen Member Posts: 75 Expert
    5 Insightfuls First Anniversary Name Dropper
    edited February 2022
    Options
    There's heaps of good advice in here, so the only comment I'll make is that the data you seem to be tracking is lagging data. Are you also looking at leading indicators to predict what will happen with your MRR? That's one area where KPI can "talk to each other". Metrics here would include things like adoption rates, CSM engagement with customer contacts, goal setting, milestone reaching/celebrating, attending Office Hours, etc.